
Store dashboard · ABC & XYZ
Which products make the money
Products are split into segments by revenue and demand stability — with a recommendation for each.
Connect your Uzum storeNo card requiredFrom 499,000 so'm a month
What's on the screen
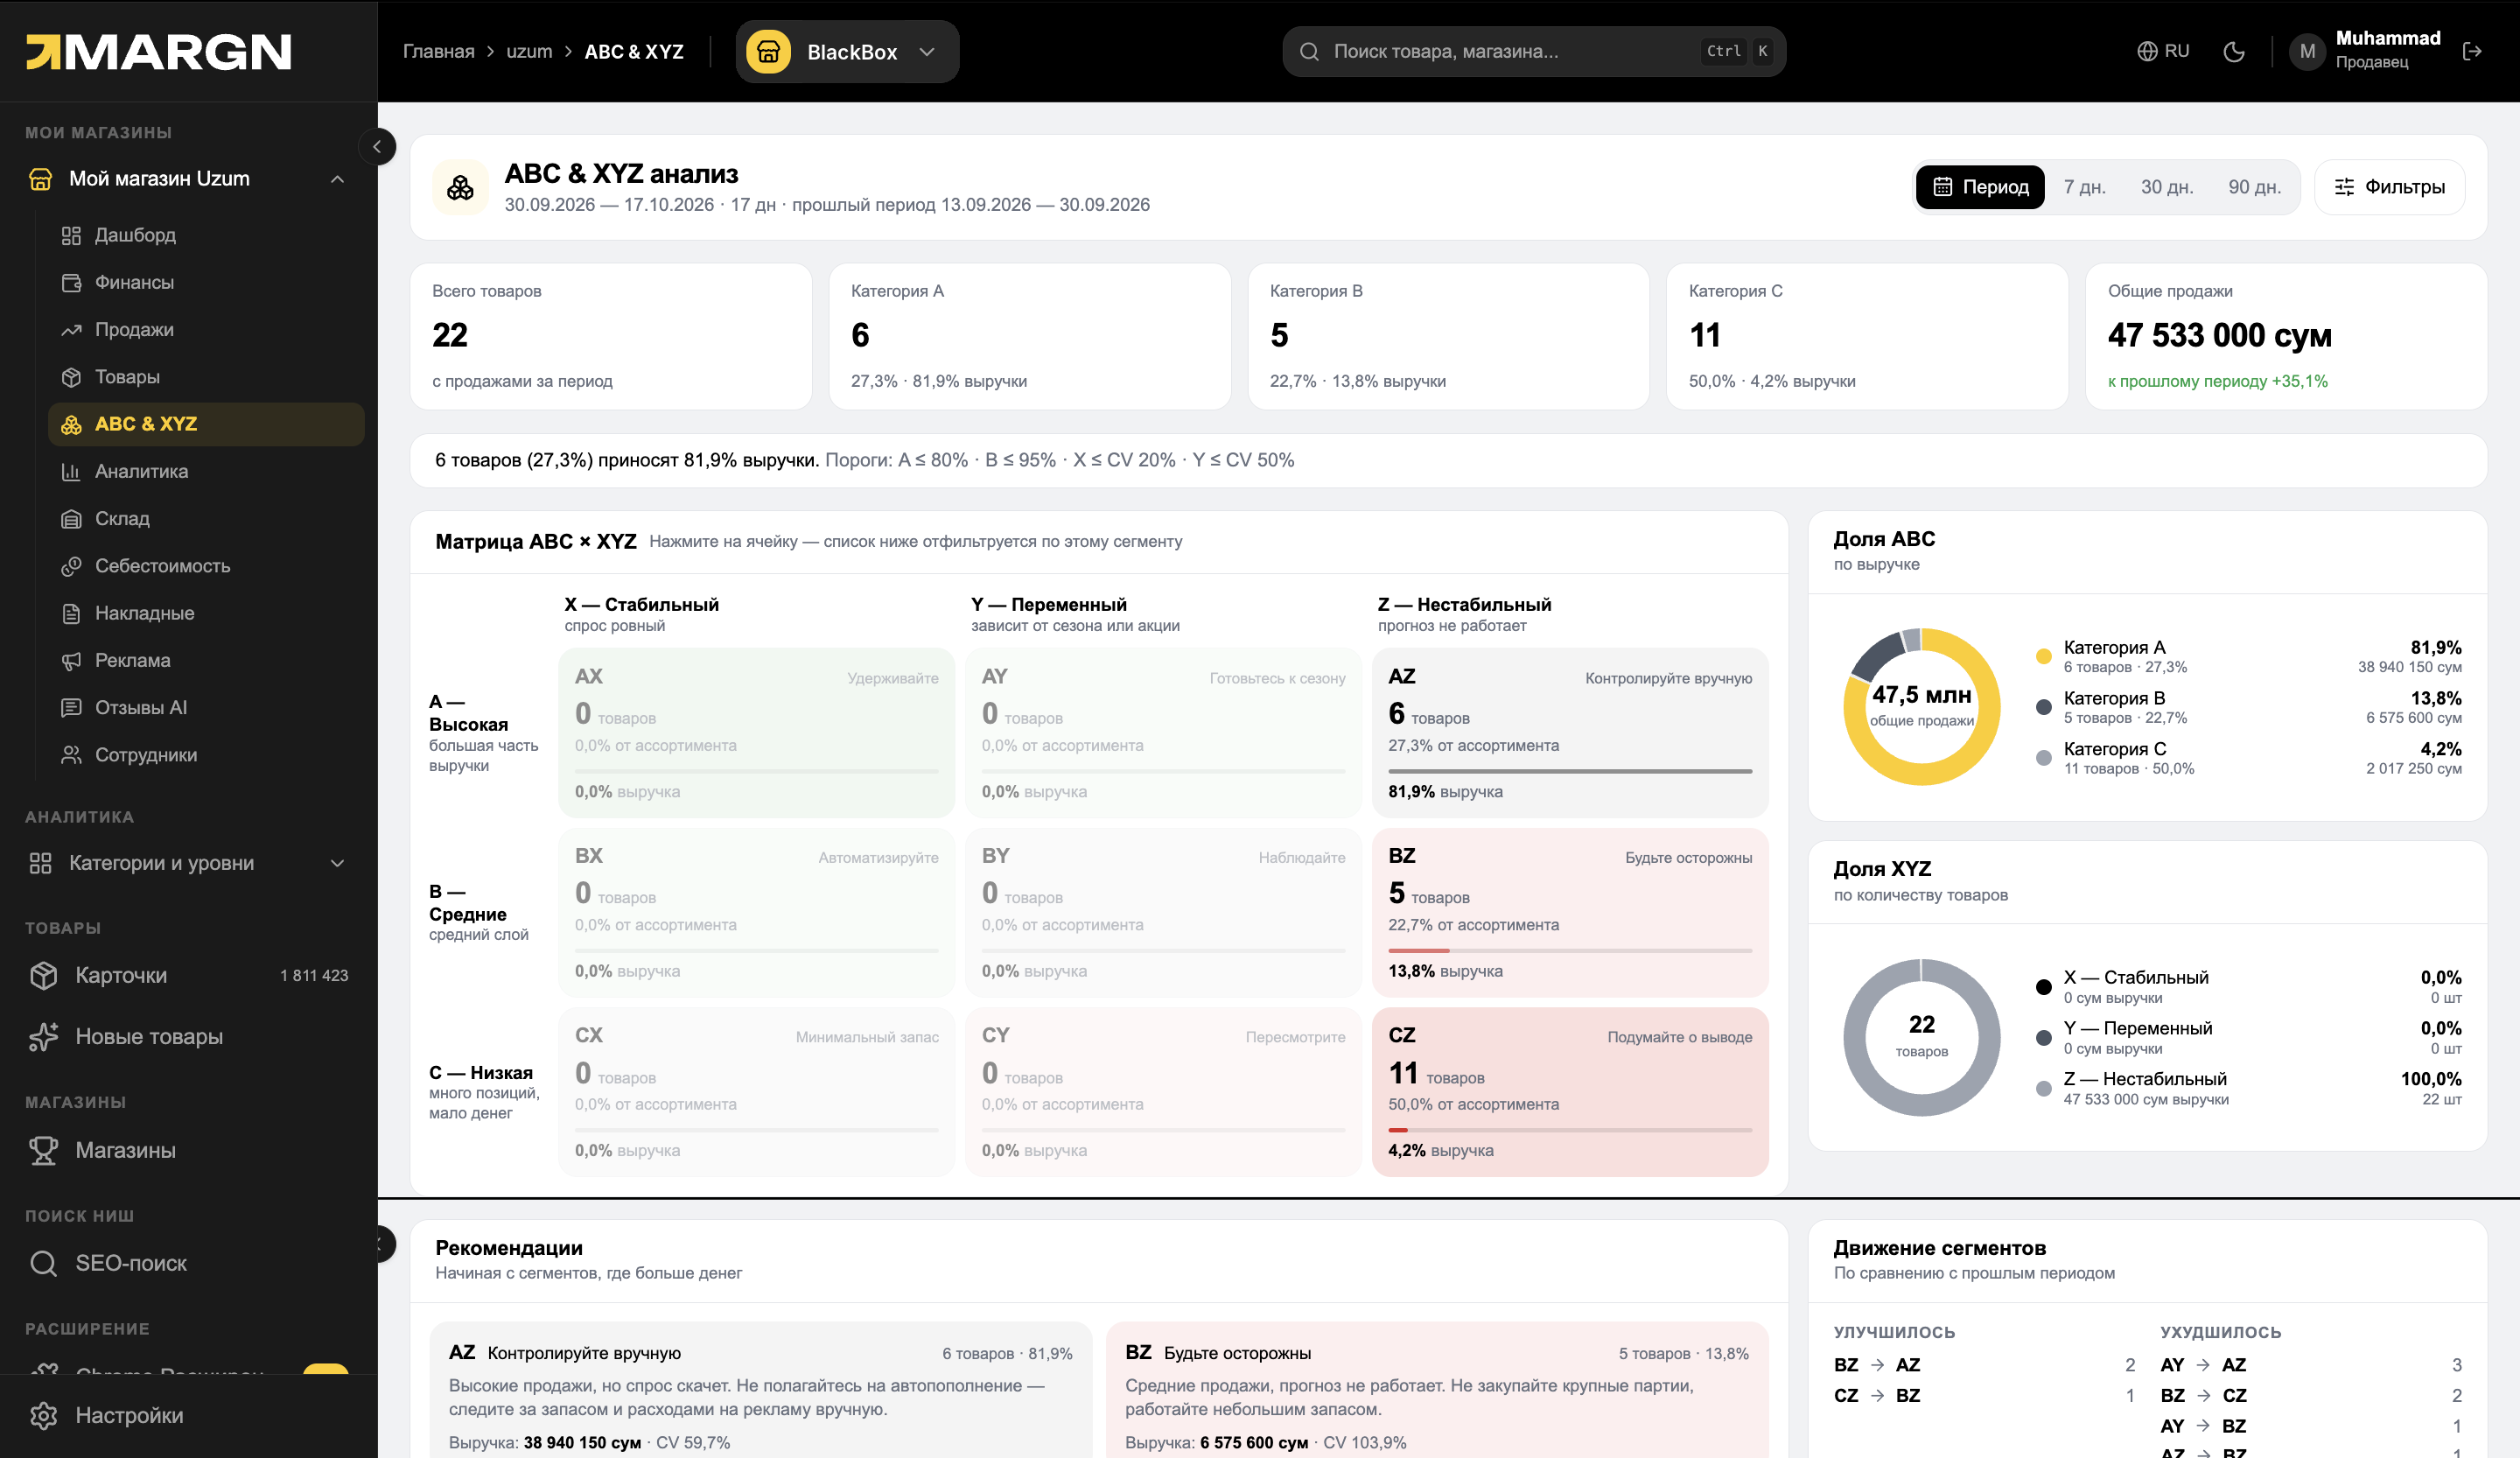
1
Overall metricsNumber of products, groups A, B, C and total turnover.
2
ABC × XYZ matrixClick a cell — the list below is filtered by segment.
3
SharesShare of revenue and products by ABC and XYZ.
4
Recommendations and movementA recommendation for each segment and transitions compared with the previous period.
9 segmentsABC × XYZ matrix
Recommendationfor each segment
Movementcomparison with the previous period
Questions it answers
Who brings the main revenue?Group A: few products, a lot of revenue.
Which products have stable demand?X — stable, Y — seasonal, Z — unstable.
Who needs stock?A clear recommendation for each segment.
Which products changed segment?Improved and declined products.
How it works
1Choose a period7, 30, 90 days or your own dates.
2Read the matrixClick a cell to open the segment.
3Follow the recommendationStock, price or assortment.
Questions and answers
What are ABC and XYZ?
ABC — groups by revenue (A ≈ 80%, B ≈ 15%, C ≈ 5%). XYZ — demand stability (coefficient of variation).
Can the thresholds be changed?
The thresholds are shown on the screen: A ≤ 80%, B ≤ 95%, X ≤ CV 20%, Y ≤ CV 50%.
Which plan includes it?
Start and Pro. The first 14 days are free.
Other store dashboard sections
DashboardYour store at a glanceFinance and cost priceReal net profit — no guessworkOrders and cancellationsEvery order and every cancellationProduct profitProfit for every listingStock and invoicesStock and replenishment planAdvertisingIs advertising paying offAI reviewsAI writes the replies to your reviews
See your store in numbers
14 days of full access. No card needed.